

Interpreting Distance–Time Graphs of Two Travellers
Interpreting Distance–Time Graphs of Two Travellers
Secondary 3
The graph shows the journeys of Andy and Gary between Towns \(P\) and \(Q\) which are \(25\) km apart.
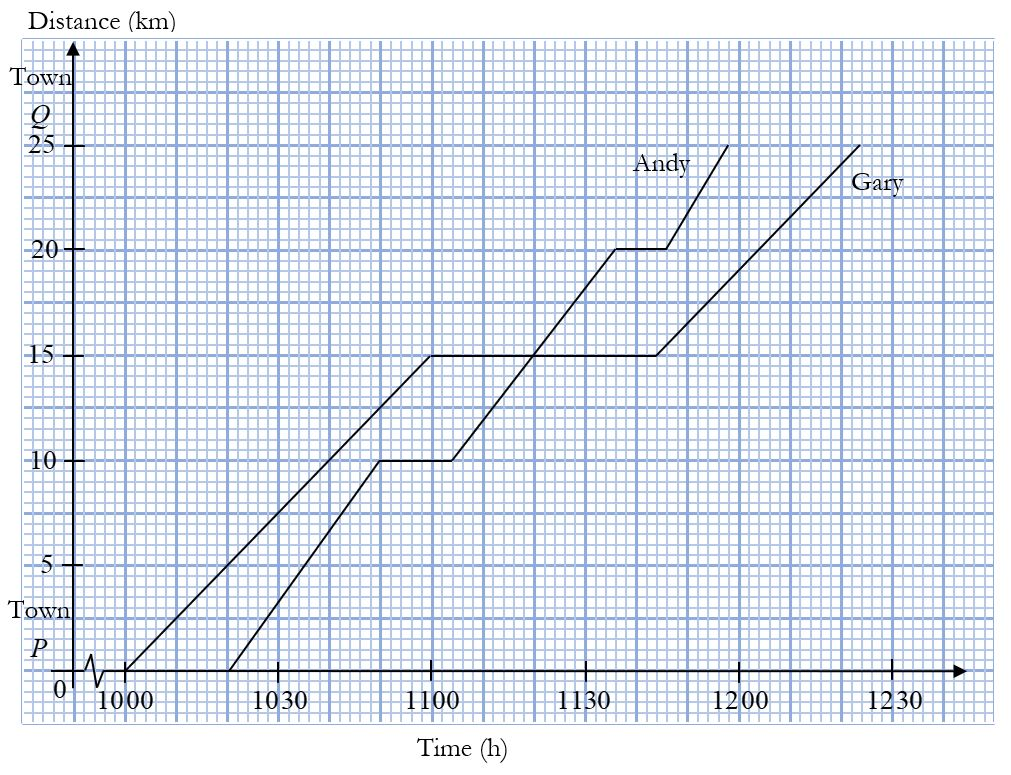
Using the graph,
- find the distance Gary was from Town \(Q\) when he stopped for a rest,
- find the amount of time Gary rested,
- state the time Andy overtook Gary,
- find the distance between Gary and Andy at \(1050\),
- calculate the average speed for Andy’s whole journey, correct to \(3\) significant figures.
Video Solution:
Video solution locked
A free account saves your progress; this video needs a course plan.
Solution:
Solution locked
680+ questions here come with free worked solutions. A free account saves your questions and progress; this one needs a course plan.
Create a free account to practise similar questions.
Answer:(i) \(10\) km (ii) \(44\) minutes (iii) 1120 (iv) \(2.5\) km (v) \(15.3\) km/h
Need help? Join our E-Maths tuition for O-Level success.
Learn more