

Graphical Modeling: Kinematics and Rates of Change
Graphical Modeling: Kinematics and Rates of Change
The container, shown in the diagram, is initially full of water.
There is a hole at the bottom and water is leaking through the hole at a constant rate.
It takes \(1\) minute, \(3\) minutes and \(2\) minutes for the water level to drop a depth of \(5\) cm, \(8\) cm and \(12\) cm respectively.
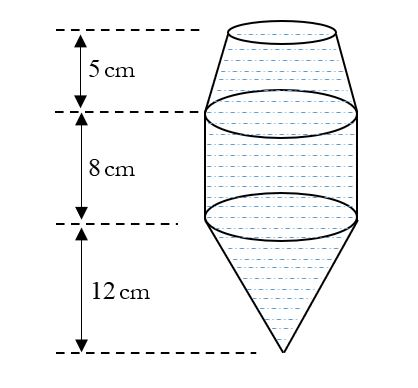
On the axes in the answer space, sketch the graph showing the depth of the water, \(h\) cm, in the container varying over the \(6\) minutes.
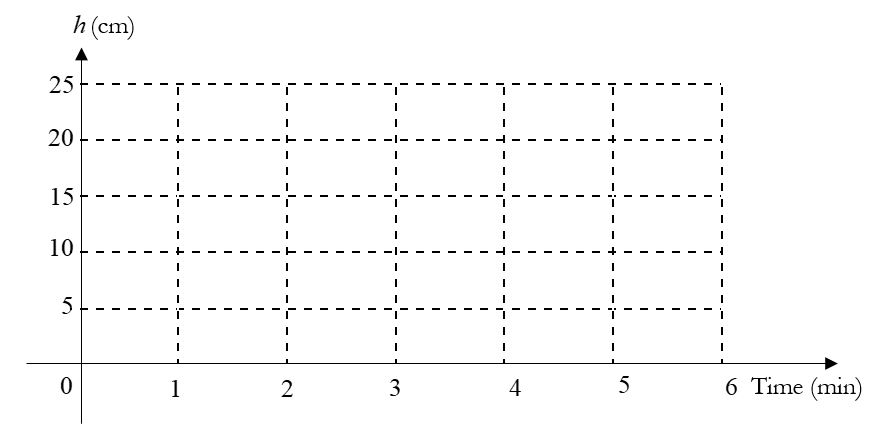
Source consistency: if the cone and cylinder have the same join radius as drawn, their volumes are in the ratio \((12/3):8=1:2\), but the stated emptying times are \(2:3\). These cannot both hold at one constant flow rate. The sketch follows the supplied stage times and qualitative shapes; its exact slopes at the join cannot be inferred consistently from all the givens.
Video Solution:
Video solution locked
A free account saves your progress; this video needs tuition enrolment.
Solution:
Solution locked
680+ questions here come with free worked solutions. A free account saves your questions and progress; this one needs tuition enrolment.
Create a free account to practise similar questions.
Need help? Join our IP Math tuition programme.
Learn more